Reading into the Crypto Fear and Greed Index

The Crypto Fear and Greed Index compresses Bitcoin volatility, momentum and public attention into one score. Its label becomes useful when compared with price over time.
Table of Contents
- What a Fear and Greed score means
- How the index is calculated
- How it differs from CNN Fear and Greed and VIX
- Is it a Bitcoin or whole-market indicator?
- Does extreme fear identify market bottoms?
- How price and sentiment separated in 2026
- How to read price and sentiment together
- A practical way to use the index
- Questions the score cannot answer
- Frequently asked questions
- Methodology
What a Fear and Greed Score Means
The index places market sentiment on a scale from 0 to 100. Alternative.me has historically divided that scale into five categories:
| Score | Classification |
|---|---|
| 0–25 | Extreme Fear |
| 26–46 | Fear |
| 47–54 | Neutral |
| 55–75 | Greed |
| 76–100 | Extreme Greed |
Suppose the index reads 40. That number falls in the fear category, but its recent path changes the interpretation. A rise from 15 suggests that the most intense stress is easing. A fall from 70 shows confidence deteriorating even though both paths finish at the same score.
Bitcoin’s behaviour during that change provides the next piece of context. If the price has already recovered sharply, the index may be recording a move that is under way. A flat price alongside improving sentiment suggests that market behaviour is changing before a clear breakout appears.
How the Crypto Fear and Greed Index Is Calculated
Alternative.me produces its daily value from several measures of Bitcoin market activity:
- Volatility – 25%: Bitcoin’s volatility and drawdowns are compared with their 30- and 90-day averages. An unusual increase pushes the score toward fear.
- Market momentum and volume – 25%: Current momentum and trading volume are measured against recent averages. Strong buying volume during an advance raises the score.
- Social media – 15%: The calculation examines the number and speed of interactions involving Bitcoin-related posts.
- Bitcoin dominance – 10%: Growing Bitcoin market share is interpreted as movement away from more speculative crypto assets. Lower dominance can reflect greater demand for altcoin risk.
- Google Trends – 10%: Changes in Bitcoin-related searches help identify sudden increases in public attention or concern.
Surveys remain displayed as a 15% component on the methodology page, where they are marked “currently paused.” Alternative.me also says the live calculation draws from five sources. The public documentation does not explain how the paused weight is handled.
This leaves enough information to understand the inputs, though not enough to reproduce the daily result. Users ultimately depend on the score published by Alternative.me.
How It Differs From CNN Fear and Greed and VIX
Similar names can hide important methodological differences. The three commonly compared indicators cover different markets and data.
| Indicator | Market | What it measures |
|---|---|---|
| Crypto Fear and Greed | Primarily Bitcoin | Volatility, momentum, volume, social activity, dominance and search interest. |
| CNN Fear and Greed | U.S. equities | A composite of seven stock, bond, options and volatility indicators. |
| VIX | S&P 500 options | The options market’s expectation of near-term S&P 500 volatility. |
Cboe calculates the VIX from S&P 500 option prices. It estimates the expected scale of near-term movement. The calculation does not choose a bullish or bearish direction.
The Crypto Fear and Greed Index draws from a wider mix of market and attention data. Its score represents the mood surrounding Bitcoin rather than expected volatility in the U.S. stock market.
Is It a Bitcoin or Whole-Market Indicator?
Alternative.me’s methodology describes its published calculation as Bitcoin-focused. That scope matters when the score is used to evaluate other cryptocurrencies.
Bitcoin frequently sets the wider market’s tone during large rallies and sell-offs. Individual tokens still react to their own liquidity, supply schedules, security incidents, exchange listings and project announcements.
An altcoin may fall during a period of broad market greed because a large token unlock has increased its available supply. Another may rise while Bitcoin sentiment remains weak after releasing a product or securing a major listing. In either case, the market-wide score provides background rather than an explanation for the individual move.
Does Extreme Fear Identify Market Bottoms?
A common trading rule says to buy during extreme fear and reduce exposure during extreme greed. The first eight months of 2026 provide a useful test of the first half of that rule.
Coindoo compared 14-day-separated extreme-fear observations with subsequent Bitcoin returns. Index readings came from the Alternative.me API, while prices came from CoinGecko’s daily UTC data.
| Extreme-fear observation | Index | BTC price | 7-day return | 30-day return | 90-day return |
|---|---|---|---|---|---|
| January 1, 2026 | 20 | $87,575 | +4.2% | -4.0% | -22.2% |
| January 21, 2026 | 24 | $88,417 | +0.8% | -24.2% | -14.2% |
| March 19, 2026 | 23 | $71,220 | +0.1% | +8.3% | -7.9% |
| May 19, 2026 | 25 | $76,959 | +0.4% | -16.3% | -18.3% |
| June 2, 2026 | 23 | $71,320 | -11.6% | -15.9% | N/A |
| July 8, 2026 | 20 | $63,335 | +2.6% | +1.5% | N/A |
| July 31, 2026 | 25 | $64,777 | -0.8% | N/A | N/A |
Source: Coindoo calculation using the Alternative.me API and CoinGecko Bitcoin data. Percentages are rounded.
The median return was 0.4% after seven days, -9.9% after 30 days and -16.3% after 90 days. Five of the seven observations produced a positive first week. Only two of the six completed 30-day periods remained positive, and all four completed 90-day periods ended lower.
Short rebounds were common, but the wider decline frequently resumed. A trader buying every selected extreme-fear reading would have received little protection from the low sentiment score over the longer measurement periods.
The sample contains seven observations and covers part of one year, so the percentages describe that period only. The medium-term results still give readers a clear reason to examine price before treating extreme fear as an entry.
Low readings often arrive after a major decline has already damaged confidence. They can then persist through forced selling, failed recoveries and further losses before Bitcoin establishes a durable base.
How Price and Sentiment Separated in 2026
On March 4, 2026, Bitcoin moved above $71,000 while the index remained at 19. The recovery had begun before the sentiment reading reflected the change.
On March 22, the index reached 10 as Bitcoin traded below $69,000. Price and sentiment were then recording the same market stress.
Another configuration appeared in August. Bitcoin’s 30-day sentiment average was recovering toward its longer-term average, while price was still testing resistance near $65,000. The chart had not yet confirmed a broader recovery.
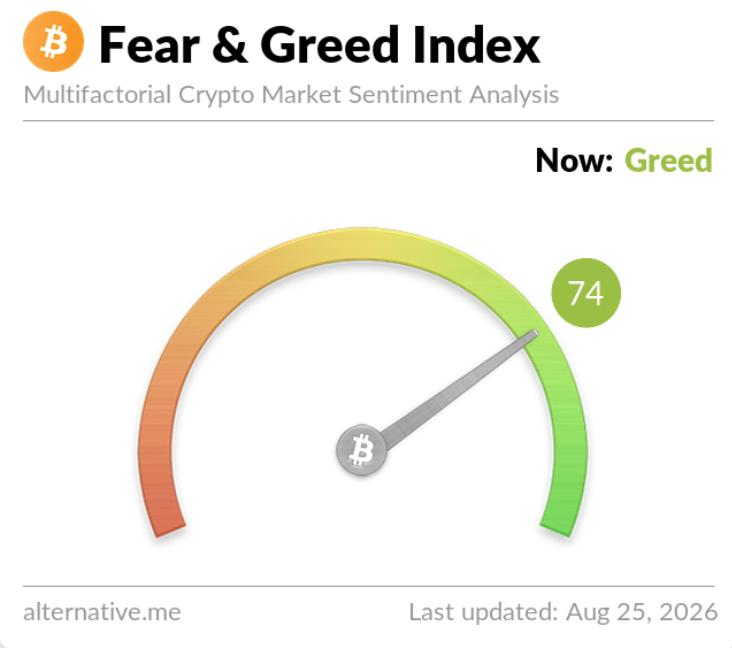
By August 25, the daily index had reached 74 after Bitcoin rallied toward $79,000. This time, the stronger reading followed a move already visible in the market.
These episodes lead to four practical combinations.
How to Read Price and Sentiment Together
| Bitcoin price | Sentiment | What to check |
|---|---|---|
| Rising | Rising | Whether spot volume and market structure support the increase in risk appetite. |
| Rising | Still fearful | Whether price has reclaimed resistance before sentiment recognises the recovery. |
| Falling | Still greedy | Whether confidence is lingering after momentum has weakened. |
| Falling | Becoming more fearful | Whether support is absorbing the selling or beginning to fail. |
When price rises ahead of sentiment, mark the resistance that previously stopped the market. A close above that level, followed by a successful retest and stronger spot volume, gives the recovery a firmer structure.
When price weakens during greed, move the focus to support. A shallow pullback that attracts buyers differs from repeated closes below a former breakout level. The score alone cannot distinguish between them.
A Practical Way to Use the Index
Start with the score, then open the Bitcoin chart.
- Establish the price trend. Identify whether Bitcoin is advancing, declining or ranging. For example, a rise in sentiment carries more weight after price has reclaimed an established resistance level.
- Measure the change. Compare the latest score with its values from one week and one month earlier.
- Check separate evidence. Examine spot volume, market liquidity, derivatives positioning and the event driving the move. A rally supported mainly by leveraged positions carries different risks from one led by spot demand.
- Define the trade risk. Set the entry, invalidation level, maximum acceptable loss and estimated execution costs before placing an order.
Price, volume and volatility already contribute to the sentiment calculation. Counting them again as independent confirmation can create a false impression that several separate signals agree.
Our guide to what traders should understand before trading crypto explains how position sizing, execution and written risk rules influence the outcome after an indicator produces a signal.
Traders who use the index repeatedly should record the score, Bitcoin’s price structure, the reason for the trade and the eventual result. A written record makes failed signals as visible as successful ones.
Questions the Score Cannot Answer
The index leaves three practical questions open: when the market will turn, how the final score was produced and whether its attention data accurately reflects real investors.
- When will sentiment reverse? Fear and greed can persist for weeks, so a category provides no precise entry or exit date.
- How was the exact score calculated? The public methodology lists its inputs and broad weights without disclosing the complete formula or treatment of the paused survey component.
- Who is driving the online activity? Social posts may come from real users, automated accounts, coordinated campaigns or recycled content.
The social-media component deserves particular care. A joint Investor.gov bulletin from the SEC’s investor-education office and FINRA warns that social-sentiment tools may contain inaccurate, incomplete, misleading or stale information. It also warns that sentiment-based signals can encourage impulsive decisions.
That guidance is relevant to the Crypto Fear and Greed Index because social activity contributes directly to its daily score.
Frequently Asked Questions
Is extreme fear a Bitcoin buying signal?
No. Check whether Bitcoin has stabilised, reclaimed resistance or attracted stronger spot demand before evaluating an entry.
Does the index cover altcoins?
Alternative.me describes the published calculation as Bitcoin-focused, so individual altcoins require separate research.
How frequently is the index updated?
Alternative.me publishes one value per day and makes historical readings available through its API.
Can the index predict a market crash?
No. It records sentiment without providing a dependable date, catalyst or price level for a reversal.
How should a change in the score be interpreted?
Compare the index’s direction with Bitcoin’s price movement over the same period.
What should be checked alongside it?
Review price structure, spot volume, market liquidity, derivatives positioning and the event driving the move.
One Check Before Using the Score
Compare the index’s one-week change with Bitcoin’s one-week price move. This shows whether the sentiment reading is moving with the market or reacting after the price has already changed.
Next, examine the level that would confirm or invalidate the price move. Volume and the underlying catalyst can show how much support the change has. Position size and maximum loss remain separate decisions.
Methodology
- The index methodology and classifications were checked against Alternative.me on August 25, 2026.
- Bitcoin prices in the historical study were obtained from CoinGecko’s daily market data in UTC.
- The study covers data available from January 1 through August 25, 2026.
- January 1 is treated as the first qualifying observation within the 2026 sample. It is not presented as a confirmed transition from the previous category on December 31, 2025.
- Later observations were recorded when the index entered extreme fear and at least 14 calendar days had passed since the previous selected observation.
- The observations are separated by 14 days, but some 30- and 90-day return windows overlap. The results should therefore be read as a description of the period rather than statistically independent events.
- Forward returns compare Bitcoin’s daily UTC observation on the signal date with the observation 7, 30 or 90 calendar days later.
- Incomplete forward periods are marked N/A and excluded from the aggregate calculations.
- The test excludes trading fees, spreads, slippage, funding costs and taxes.
This article is for informational purposes only and does not constitute financial, legal or tax advice. Cryptocurrency trading can result in partial or complete loss of capital.



Alexander Zdravkov is a market analyst and crypto journalist with interests in economics, broader financial markets and digital assets. His journey into crypto began more than four years ago, driven by a fascination with the rapid evolution of blockchain technology and the transformative potential of decentralized finance. He began analyzing market cycles and identifying emerging trends before they reach the mainstream. He holds a degree in International Relations - a background that helped shape his broader perspective on global economics, geopolitics, and the interconnected nature of modern financial markets. Whether covering the latest developments in the crypto sector or exploring broader macroeconomic themes, Alexander focuses on giving readers context rather than simply repeating headlines. During his career, he has authored more than 5,000 articles covering cryptocurrencies, traditional finance, and global market developments. His work spans everything from Bitcoin and altcoins to macroeconomic trends influencing risk assets worldwide.